Gary Valle's Photography on the Run
Images taken on trail runs, and other adventures, in the Open Space and Wilderness areas of California, and beyond. All content, including photography, is Copyright © 2006-2012 Gary Valle. All Rights Reserved.
# Thursday, September 20, 2012

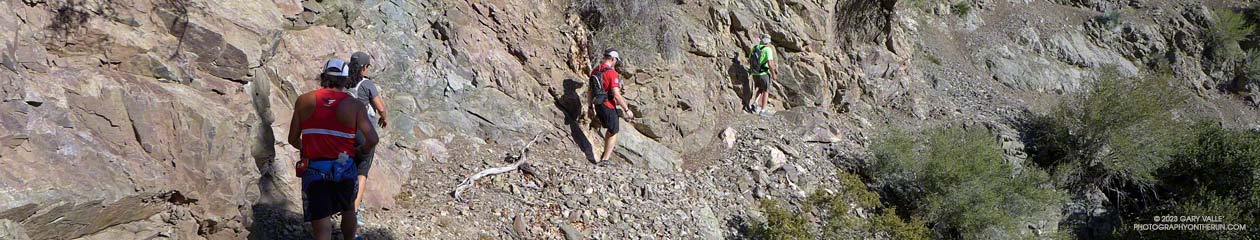
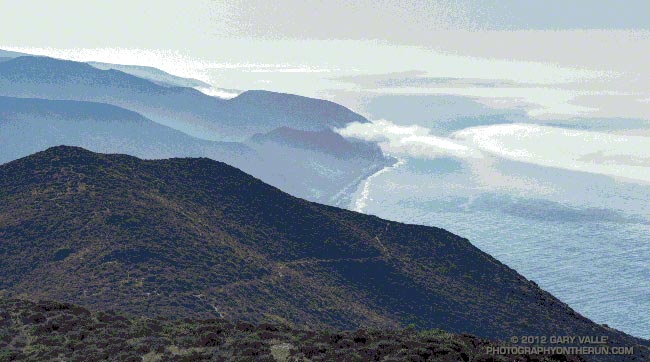
Coastline south of Pt. Mugu from Mugu Peak. The trail wrapping around the lower peak is the Mugu Peak Trail. It leads to the La Jolla Loop and Canyon trails. There were several runners on the Mugu Peak trail, training for the XTERRA Pt. Mugu Trail Run.

From Sunday's out and back run from the Wendy Drive to Mugu Peak.

Related post: La Jolla Valley & Mugu Peak from Wendy Drive

Thursday, September 20, 2012 9:09:08 AM (Pacific Daylight Time, UTC-07:00)  #   
# Sunday, September 09, 2012

Las Virgenes Canyon sunrise

The trail was exposed and sweat was dripping from the brim of my cap like a faucet with a worn out washer. Expecting a warm day I had started my run early -- before sunrise -- but that had not been early enough. It was 8:30 am and the temperature was already over 90°F. It was not only hot, it was humid. Monsoon clouds were scattered across the sky, but somehow the sun was dodging all of them. It was disturbingly familiar.

Even if the weather wasn't perfect, the run was a good one. I was doing a loop from the Las Virgenes Trailhead of Upper Las Virgenes Canyon Open Space Preserve. There are two trails here -- the main trail which follows Las Virgenes Creek north up the canyon, and a power line service road (about 50 yards south of the first) that climbs out of Las Virgenes Canyon and leads west to the Cheeseboro Ridge Trail.

I had taken the power line service road, and worked west over to the Cheeseboro Canyon trailhead, then up the Modelo Trail and over to Palo Comado Canyon. Now I was a couple of miles up-canyon on an unmaintained, but well-used, single track trail that links the Palo Comado fire road with the Sheep Corral Trail. Once on the Sheep Corral Trail I could follow it east past Shepherds' Flat all the way back to Las Virgenes Canyon.

There would be some relief from the heat once I reached Las Virgenes Canyon, but this was really a run better done on a cool day. On the calendar Autumn was just days away. Southern California or not, eventually the weather would cool. The development of a weak to moderate El Nino had stalled, but nearly all forecasts indicated further development was imminent. Maybe a little rain wasn't too many weeks away.

With an elevation gain of only 1800' over 14 miles this route includes long stretches of faster-paced trail -- both single track and dirt road -- but there are some good hills as well. Many variations are possible. This Park Service PDF shows the trails in the area.

Some related posts: Upper Las Virgenes Canyon - Cheeseboro Ridge Loop, Owl Feather on the Modelo Trail, Las Virgenes Creek Near the Sheep Corral Trail

Sunday, September 09, 2012 8:30:14 AM (Pacific Daylight Time, UTC-07:00)  #   
# Saturday, September 08, 2012

Tarantula at Ahmanson Ranch

Updated October 18, 2012.

Since 2005 these are the dates I've photographed a tarantula at Ahmanson Ranch (Upper Las Virgenes Canyon Open Space Preserve).

September 05 (2012)
September 08 (2006)
September 13 (2005)
September 19 (2007)
September 15 (2009)
October 3 (2012)
October 9 (2012)
October 11 (2006)
October 12 (2011)
October 17 (2012)
October 17 (2012)

Autumn is when maturing male tarantulas (Aphonopelma spp.) wander about in search of a mate.

Four tarantula sightings this October brings the total for Sep/Oct 2012 to five -- by far the most I've seen at Ahmanson during September and October. Last week this tarantula was making his way up a trail in East Las Virgenes Canyon.

The title photograph is from a run on September 5. The raised abdomen is a defensive posture. Tarantulas will scrape their abdomen with their bristly rear legs, launching irritating (urticating) barbed hairs into the air. Most tarantulas I've encountered this time of year do not react defensively -- they're just interested in finding a mate.

Some related posts: Tarantula Time, Sting of the Tarantula Hawk, Tarantula Hawk

Saturday, September 08, 2012 7:42:35 AM (Pacific Daylight Time, UTC-07:00)  #   
# Friday, September 07, 2012

Originally posted July 31, 2009.

"What's the elevation gain?" is a common question when talking about a trail run, because it makes such a huge difference in the difficulty of the run. A long-standing rule of thumb, Naismith's Rule, says that the additional time required to gain 1000 ft. of elevation on a run/hike, will be the same as the time to run/hike 8000 ft. (1.5 miles) on the flat. An analysis of fell running records supports this 1 to 8 ratio.

This is not news to anyone who runs or hikes hilly trails. The first thing I check when evaluating a new race or run is the elevation gain. All the technology we have for recording and analyzing trail runs is remarkable, but it can sometimes result in wildly inaccurate claims about the elevation gain of a course.

The table to the left lists the elevation gain calculated by various software and services for the the same course using GPS tracks from a Garmin Forerunner 205 and Forerunner 405. The course is the Islip Saddle - SF Campground - Mt. Baden-Powell loop in the San Gabriel Mountains.  SportTracks elevations were corrected using pkan's Elevation Correction Plugin and SRTM elevations data in 2009 and NED 1/3 arc second DEMs in 2012. SportTracks elevation data smoothing was set to 55.

Calculations of elevation gain have improved since 2009. One reason is newer GPS chips generally produce higher quality tracks. Another is the methods used to calculate elevation gain/loss have improved and more accurate elevation datasets have become readily available and integrated into software such as SportTracks and services such as Garmin Connect.

So which of these elevation gains is the closest to reality? Fortunately, it's fairly easy to do a low tech sanity check of these high tech results. All that is required is to get out an USGS topo map -- either electronically or on paper -- and do a little arithmetic.

Let's see. From South Fork Campground (4560') to the summit of Mt. Baden-Powell (9399') is about 4839'. But there are a couple of small descents on the way up so we add another 240' giving a total to the top of Mt. Baden-Powell of 5079'. It's mostly downhill from Baden-Powell to Islip Saddle, but there are a couple of hills. The main one is a 370' climb on the PCT up and over the shoulder of Throop Peak. There's also another 100' climb near Mt. Burnham, and if you stop at Little Jimmy Spring another 60' climb. This gives a total of 5609'. Adding in a fudge factor of 100' for very small climbs that were not included in the total and the result is a reality-checked elevation gain of about 5700'. Comparing this total to the computed elevation gains in the table, the actual gain might be as much as 6000', but it's not likely to be 7500'. And there's just no way the gain is 9975'!

The title photograph is from the Momyer Trail on San Gorgonio Mountain.

Related post: Hitting the (Big) Hills of Southern California

Friday, September 07, 2012 1:13:10 PM (Pacific Daylight Time, UTC-07:00)  #   
# Tuesday, September 04, 2012


Williams Fire MODIS fire detections as of 09/04/12 1745 MDT

Here's an interactive Google Earth browser view of the most recently available Williams Fire MODIS fire detections and perimeter, and perimeters for the Curve (2002), Williams (2002) and Morris (2009) fires. This is a 3D view that can be zoomed and tilted. Fire detection overlay may take a few moments to load. Placemark locations are approximate. Requires Google Earth plugin.

Snapshots:

Williams Fire MODIS fire detections as of 09/07/12 0800 MDT.

Williams Fire MODIS fire detections as of 09/06/12 0800 MDT.

Williams Fire MODIS fire detections as of 09/05/12 1615 MDT.

Williams Fire MODIS fire detections as of 09/05/12 0900 MDT.

Williams Fire MODIS fire detections as of 09/04/12 1745 MDT.

Williams Fire MODIS fire detections as of 09/04/12 0815 MDT.

Williams Fire MODIS fire detections as of 09/03/12 1600 MDT.

MODIS Google Earth fire data is from the USDA Forest Service Remote Sensing Applications Center Active Fire Mapping Program web site. The 2002 Curve and 2002 Williams perimeters are from the CDF/FRAP web site, and the 2012 Williams and 2009 Morris fire perimeters are from the GEOMAC web site.

Tuesday, September 04, 2012 4:09:59 PM (Pacific Daylight Time, UTC-07:00)  #   
# Saturday, September 01, 2012

Racing the Sun II

An alternative rendition of an image posted in November 2007. Did this version in 2007, but didn't post it at the time. A Photoshop filter was not used.

Saturday, September 01, 2012 3:21:31 PM (Pacific Daylight Time, UTC-07:00)  #   
# Friday, August 31, 2012

Castle Peak and Thunderstorms

Thunderstorms rumbled across the eastern and northern San Fernando Valley and San Gabriel Mountains while I was running up to Castle Peak yesterday afternoon.

Friday, August 31, 2012 4:38:34 PM (Pacific Daylight Time, UTC-07:00)  #   
# Sunday, August 26, 2012

Marine layer in Simi Valley from Sage Ranch Park

I like to do a short recovery run the day after a 50K. An early morning run helps smooth out the tweaks and twinges of the race, and a lingering runner's high brightens the senses and the day.

Weather-wise, the timing of the Bulldog 50K/25K was perfect. Yesterday was one of the coolest of the cool wave. Today temps were already on the way up. Here's a chart comparing the air temperature in the shade at the Malibu Canyon RAWS (near Tapia Park) for the last seven Bulldog races, and a similar chart with the fuel temperature in the sun.

As at the top of the Bulldog climb, vaporous clouds drifted among the rocks, trees and chaparral at Sage Ranch Park. Heavy dew coated the plants along the trail, and the night-cooled droplets felt like splashes of ice water on my legs. Below, a pillowy layer of clouds filled Simi Valley. I jogged along the trail, legs tired, but feeling good.

Sunday, August 26, 2012 4:48:27 PM (Pacific Daylight Time, UTC-07:00)  #   
# Friday, August 24, 2012

Reeds and redwoods, Malibu Creek State Park

From Saturday morning's run in Malibu Creek State Park.

Related post: Malibu Creek State Park Coast Redwoods

Friday, August 24, 2012 1:01:44 PM (Pacific Daylight Time, UTC-07:00)  #   
# Thursday, August 23, 2012

Bulldog 50K/25K course in Malibu Creek State Park

Updated Thursday, August 30, 2012.

Following two weeks of scorching temperatures and a torrid Mt. Disappointment 50K, it looks like we're going to catch a break and the weather for the Bulldog 50K/25K this Saturday is going to be cooler -- cooler than last year and cooler than what we've been seeing recently.

How much cooler? During our recent heat wave the Malibu Canyon Remote Automated Weather Station (RAWS) near Tapia Park recorded temps as high as 102°F, and highs were routinely in the 90s. On race day last year temps here topped out at 101°F. Yesterday the high was 80°F and forecasts suggest the high Saturday should be about the same.

But for runners these temps don't tell the whole story. These are "in the shade" temps recorded by a specially shielded and ventilated sensor. In addition, the humidity -- even if it's not East Coast humid -- can have a big impact on what the temperature feels like and how it affects running performance.

In my experience a better measure of the temperature a trail runner experiences in races such as Bulldog is the "fuel temperature." This is the temperature of a ponderosa pine dowel in direct sun. In the recent heat wave and at last year's Bulldog race the "in the sun" fuel temps at the Malibu Canyon RAWS topped out at a fiery 112-115°F. Yesterday, when the air temperature was 80°F, the fuel temperature at that station was around 100°F.

Humidity can also play an important role and it doesn't have to be super-high humidity to affect a runner. The NWS Heat Index attempts to account for the combined effect of temperature and humidity. Heat index tables can be misleading. As the NWS notes, "...heat index values were devised for shady, light wind conditions, exposure to full sunshine can increase heat index values by up to 15°F."

Last year at around 3:00 pm when the last few runners were making their way up the Tapia Spur Trail the "in the shade" air temperature recorded by the Malibu Canyon RAWS (near Tapia Park) was 99°F, but the "in the sun" fuel temperature was 114°F. The dew point (a measure of humidity) at the time was 63°F, and this would have pushed the "feels like" temperature even higher.

We shouldn't see anything like that this year.

Update Thursday, August 30, 2012. Here's a chart comparing the air temperature in the shade at the Malibu Canyon RAWS (near Tapia Park) for the last seven Bulldog races, and a similar chart with the fuel temperature in the sun.

Update Sunday, August 26, 2012, 12:00 pm. Race day (Saturday) at Malibu Creek State Park dawned cool and cloudy with the marine layer once again about 2200' deep. At the beginning of the race the temperature at the Malibu Canyon RAWS (near Tapia Park) was 63°F. As on Friday the marine layer didn't start to break up until around 9:45 am, so for many runners the entire first loop was cloudy and relatively cool. The first time up Bulldog we ran up into the clouds and eventually broke out above the cloud deck near the top of the climb -- it was spectacular! The clouds had cleared by the time I reached the Bulldog aid station on the second loop. Even though temps were warmer the second time around, it seemed that just when you needed it there was always a cooling breeze!

At 11:00 am at the Malibu Canyon RAWS the "in the shade" temperature was 73°F and the fuel temperature was 96°F. This was only about an hour after the clouds cleared, so the actual "in the sun" temperature was lower than the RAWS fuel temperature. Even though the air temperature stayed under 80°F all day, and "in the sun" temps were not as hot as they might have been, the ice water sponges at the aid stations still felt really good! It was a great day for a 50K!

Update Friday, August 24, 2012, 2:00 pm. Satellite imagery showed clearing in the Malibu Creek State Park area in progress around 10:00 am. An hour later the temperature at the Malibu Canyon RAWS (near Tapia Park) was 73°F and the "in the sun" fuel temperature had jumped to 96°F. At 2:00 pm the "in the shade" temperature was up to 78°F and the "in the sun" fuel temperature was still 98°F. Temps should be similar tomorrow for the race. We'll see!

Update Friday, August 24, 2012, 8:00 am. NWS Los Angeles/Oxnard reports marine layer about 2200' deep this morning. The top of the Bulldog climb is at about 2400' ASL. The extent of the low clouds and fog can be seen on the Pepperdine University web cams and on various CalTrans cameras along the 101 Frwy via SigAlert.com. A marine layer this deep will probably delay clearing and keep temps cooler. Yesterday at 11:00 am the Malibu Canyon RAWS (near Tapia Park) reported an "in the shade" air temperature of 71°F and an "in the sun" fuel temperature of 90°F. Temps peaked at about 2:00 pm with an air temp of 79°F and a fuel temp of 100°F. We'll see what happens today!

Thursday, August 23, 2012. At the moment it looks like the "in the shade" temperature at 11:00 am race day near Tapia Park should be around 78degF, with an "in the sun" temp approaching 100degF. The marine layer depth at the start of the race should be around 1000' with a layer of low clouds (possibly broken) that should clear before most of us complete the first 25K. We'll see!

The title photo is from a run in Malibu Creek State Park on Saturday. The Bulldog climb is on the right side of the photograph. The Corral Canyon aid station is on the low point of the skyline a little left of center, and the "gateway" rocks farther left on the skyline.

Here's an (updated) Google Earth flyover of the first loop of the Bulldog course. Press the "play" button to start the tour. The tour can be paused at any point, and you can look around by rotating, zooming, and tilting the view. The mileages are from my trace of the course in 2010 and are approximate. Placemark locations are also approximate. To view the tour the Google Earth plugin has to be installed by your browser.

Some related posts: Bulldog 50K 2010 Notes

Thursday, August 23, 2012 7:46:49 AM (Pacific Daylight Time, UTC-07:00)  #   
# Saturday, August 18, 2012

Heads up if you were planning to run the 2012 Bulldog 50K or 25K in toed running shoes. The following new rule is specified on the Bulldog Race Rules page:

"Barefoot sports shoes or toed running shoes will not be permitted to be worn at the Bulldog Trail Runs; no exceptions!"

Last year the U.S. Army banned toe shoes because of "lack of conformity with the Army’s conservative professional appearance."

Saturday, August 18, 2012 1:44:28 PM (Pacific Daylight Time, UTC-07:00)  #   
# Saturday, August 11, 2012

Mt. Markham
Mt. Markham From Near Mueller Tunnel

The water felt surprisingly chilly, and for a moment I hesitated before completely immersing myself in the cool, clear water. More a creek than a river this time of year, this crossing of the West Fork San Gabriel River was at mile 17 of the 2012 Mt. Disappointment 50K. At 2760', it's the lowest point on the course and marks the beginning of the tough 5.4 mile climb up Edison Road to Shortcut Saddle (4790').

Edison Road (FS Road 2N23) zigzags up an exposed, south-facing chaparral slope. The climb is warm on the coolest of days -- today it was going to be torrid. Southern California was locked in the grasp of a record-setting, multi-day heat wave. During the week I'd taken a thermometer on a run and measured a temperature of 107.6°F on a breezy day at Ahmanson Ranch. All week I'd been checking the computer weather models and watching the temps in the San Gabriel Mountains, hoping for a break in the weather. Nada. The day before the race the "in the sun" temps at the Clear Creek RAWS, near the race course, reached a blistering 120°F.

The performance hit from running in the heat is similar to running at higher elevation. Acclimatization helps, but hot weather reduces performance. The following is from Daniels' Running Formula:

"You can’t perform as well in a distance race in the heat as you can in a cooler environment... As soon as the body starts to heat up, blood is diverted to the skin, where cooling (through evaporation of sweat from the skin’s surface) takes place. A greater portion of the body’s blood volume is at the body’s surface to facilitate cooling, leaving less blood available for carrying oxygen to the exercising muscles. In effect, to prevent overheating, the body reduces the amount of blood available to enhance performance."

Saturday, August 11, 2012 7:56:39 AM (Pacific Daylight Time, UTC-07:00)  #